Logging in Kubernetes with Fluent Bit and OpenSearch
Logging in Kubernetes primarily serves us to log processes within a container. We expect this to lead, for example, to better auditing, a faster error analysis, and, as a result, more robust programming. Today, we want to show you how to persist and visualize logs in a meaningful way with the right tooling.
What Is Logging?
When asked what exactly logging is, we have come across all kinds of definitions and negative examples. Unfortunately, it is still far too common for people not to use logging at all in an application, or to only issue a log with the entire stack trace in the event of an error. Another (bad) way to log is to set a log at all places where anything has ever happened and not to define log levels.
We would define logging as follows:
Logging means that you keep track of processes in the program flow. Depending on the environment and the importance of the log, different indicators (log levels) and information are provided in the log. The goal should be that the log provides added value and does not overload the user with information.
A log that does not provide any significant added value might look like this:
2023/01/04 15:08:39 INFO respond successful
The only information we can extract from this log is that a response to an API call was successfully submitted.
The same log, including details that give us added value, could look like this:
2023/01/04 15:08:39 INFO respond with status 200 for /api/test after 200ms span_id:1234
Here we can find information regarding the status code, the URL called up, the time it took our application to respond, and a span ID that we can use to analyze our API call with tracing. If you want to learn more about tracing, then take a look at this blog post.
Pain Points
In a perfect world, all our logs would look like the second example or, even better, they would be structured in JSON format. However, in a distributed system landscape like Kubernetes, we usually maintain multiple applications and might only be able to influence the logs in a fraction of them. This means that reading and evaluating the logs in the application itself can be laborious. Even if the logs are neat and tidy, reading them can be difficult, especially if an application answers many requests and generates logs accordingly. At this point, at the latest, you should think about tools for collecting, processing, and visualizing the logs.
Collect and Visualize Kubernetes Logs with the Right Tools
Chosen Setup
To collect logs, we first need a place to store the data. Elasticsearch and OpenSearch have become well-established solutions for this. We use OpenSearch dashboards as a UI for analyses and visualizations. As a rule, any UI that can communicate with the chosen storage works, for example also a Grafana, if you want to have Prometheus metrics and logs visualized in the same place. You can find more information on monitoring in this blog post.
Also, Fluent Bit runs on each of our Kubernetes nodes. In the default setting, it sends all logs to OpenSearch unfiltered.
OpenSearch and Fluent Bit
OpenSearch is a fork of Elasticsearch and Kibana. The OpenSearch application is a search engine that stores your data in JSON format. For visualization, OpenSearch dashboards are used.
Fluent Bit is an extremely efficient log processor that allows us to collect logs from various sources, prepare them, and forward them to one or more destinations.
Example Logs
Below, we will take a look at the following three logs:
-
2023/01/04 15:08:39 INFO respond with status 200 for /api/test after 200ms span_id:1234 -
2023/01/04 15:08:39 ERROR login attempt failed got 400 from /auth_v2/login?Authorization=Basic SnVzdDpEb250 call -
2023/01/04 15:08:39 INFO add 5 values to cache
The first log provides essential information of an API call. Since this log is not structured as JSON, we might be able to work with search filters in OpenSearch dashboards, but it wouldn’t be possible to display meaningful visualizations such as an average response time in a graph.
For the second log, username and password are issued as basic auth. The user name and password of a user are now initially in the application log. If it is not possible to expand the log directly because, for example, you do not own the application, this log would also end up in OpenSearch and be persisted indefinitely.
The third log could be relevant, for example, for developers who are rolling out a new release of an application and checking the correct functioning through the log. So, let’s assume that after each operation n values are saved in a cache, and the log at best exists as a debug log and accidentally shows up as an info log in the final application. Again, we are not developers of the application, but we do not want to see the log in our production environment until the update.
Filtering and Processing Logs
In the default configuration of Fluent Bit in Kubernetes, all container logs are extended unfiltered with Kubernetes metadata and then forwarded to the selected database.
We will now edit our three logs in three different ways in Fluent Bit before they are sent to OpenSearch.
Disclaimer: The examples are highly simplified. Be careful when creating regular expressions so as not to generate a regex denial of service.
Log 1—Timestamp: INFO respond with status 200 for /api/test after 200ms span_id:HASH
For this, we use a parser of the type regex:
[PARSER]
-
Name request_log
-
Format regex
-
Regex ^.+(?INFO).*status (?d+) for (?.+) after (?d+)ms span_id:(?.+)$
We call up the parser via a filter in advance, e.g.:
[FILTER]
-
Name parser
-
Match *
-
Key_Name log
-
Parser request_log
-
Reserve_Data true
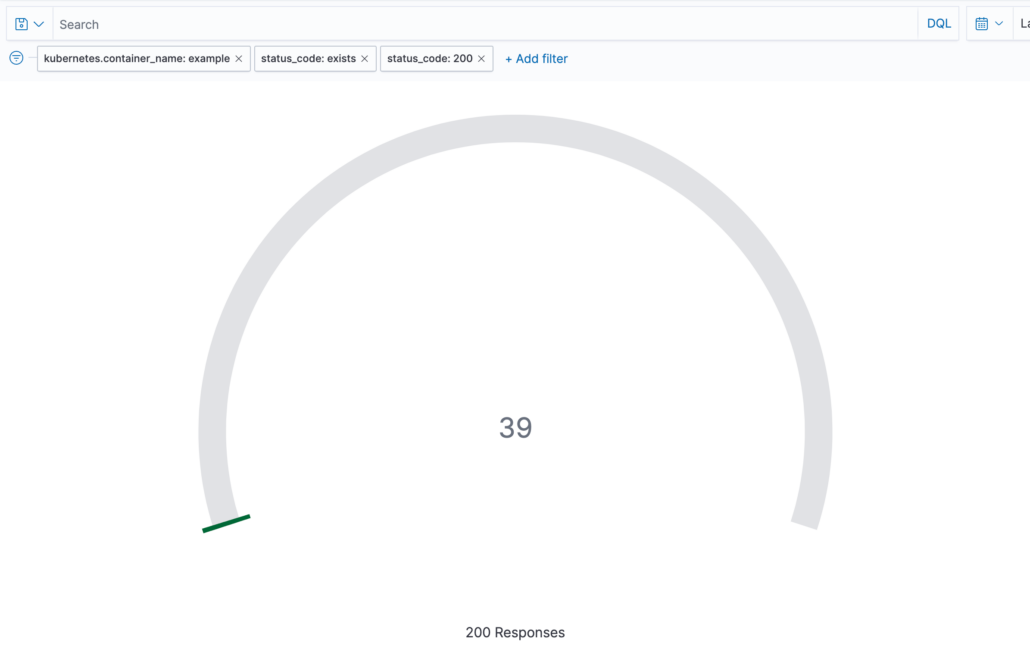
We have just structured the log with our parser and can use the keys from the capture group to filter dashboards in OpenSearch, for example, or build visualizations with the values. The span ID also allows us to find and evaluate the API call in our tracing tool. You can find more information about parsers here: https://docs.fluentbit.io/manual/pipeline/filters/parser
Visualization for counting the successful answers with the status code 200
Log 2—Timestamp: ERROR login attempt failed got 400 from /auth_v2/login?Authorization=Basic SnVzdDpEb250 call
We could simply discard the log with Fluent Bit and not include it in the database. In this case, however, we assume that we generally need the log’s information, but not the basic auth string.
Therefore, we edit the log entry using Lua:
function remove_basic_auth(tag, timestamp, record)
-
if (record["log"] ~= nil)
-
then
-
tmp_log = record["log"]:gsub("(%Basic %S+)", "********")
-
record["log"] = tmp_log
-
return 1, timestamp, record
-
end
-
return 1, timestamp, record
-
end
We call up the Lua function via a filter beforehand, e.g.:
[FILTER]
-
Name lua
-
Match *
-
script /fluent-bit/scripts/path_to_lua_script.lua
call remove_basic_auth
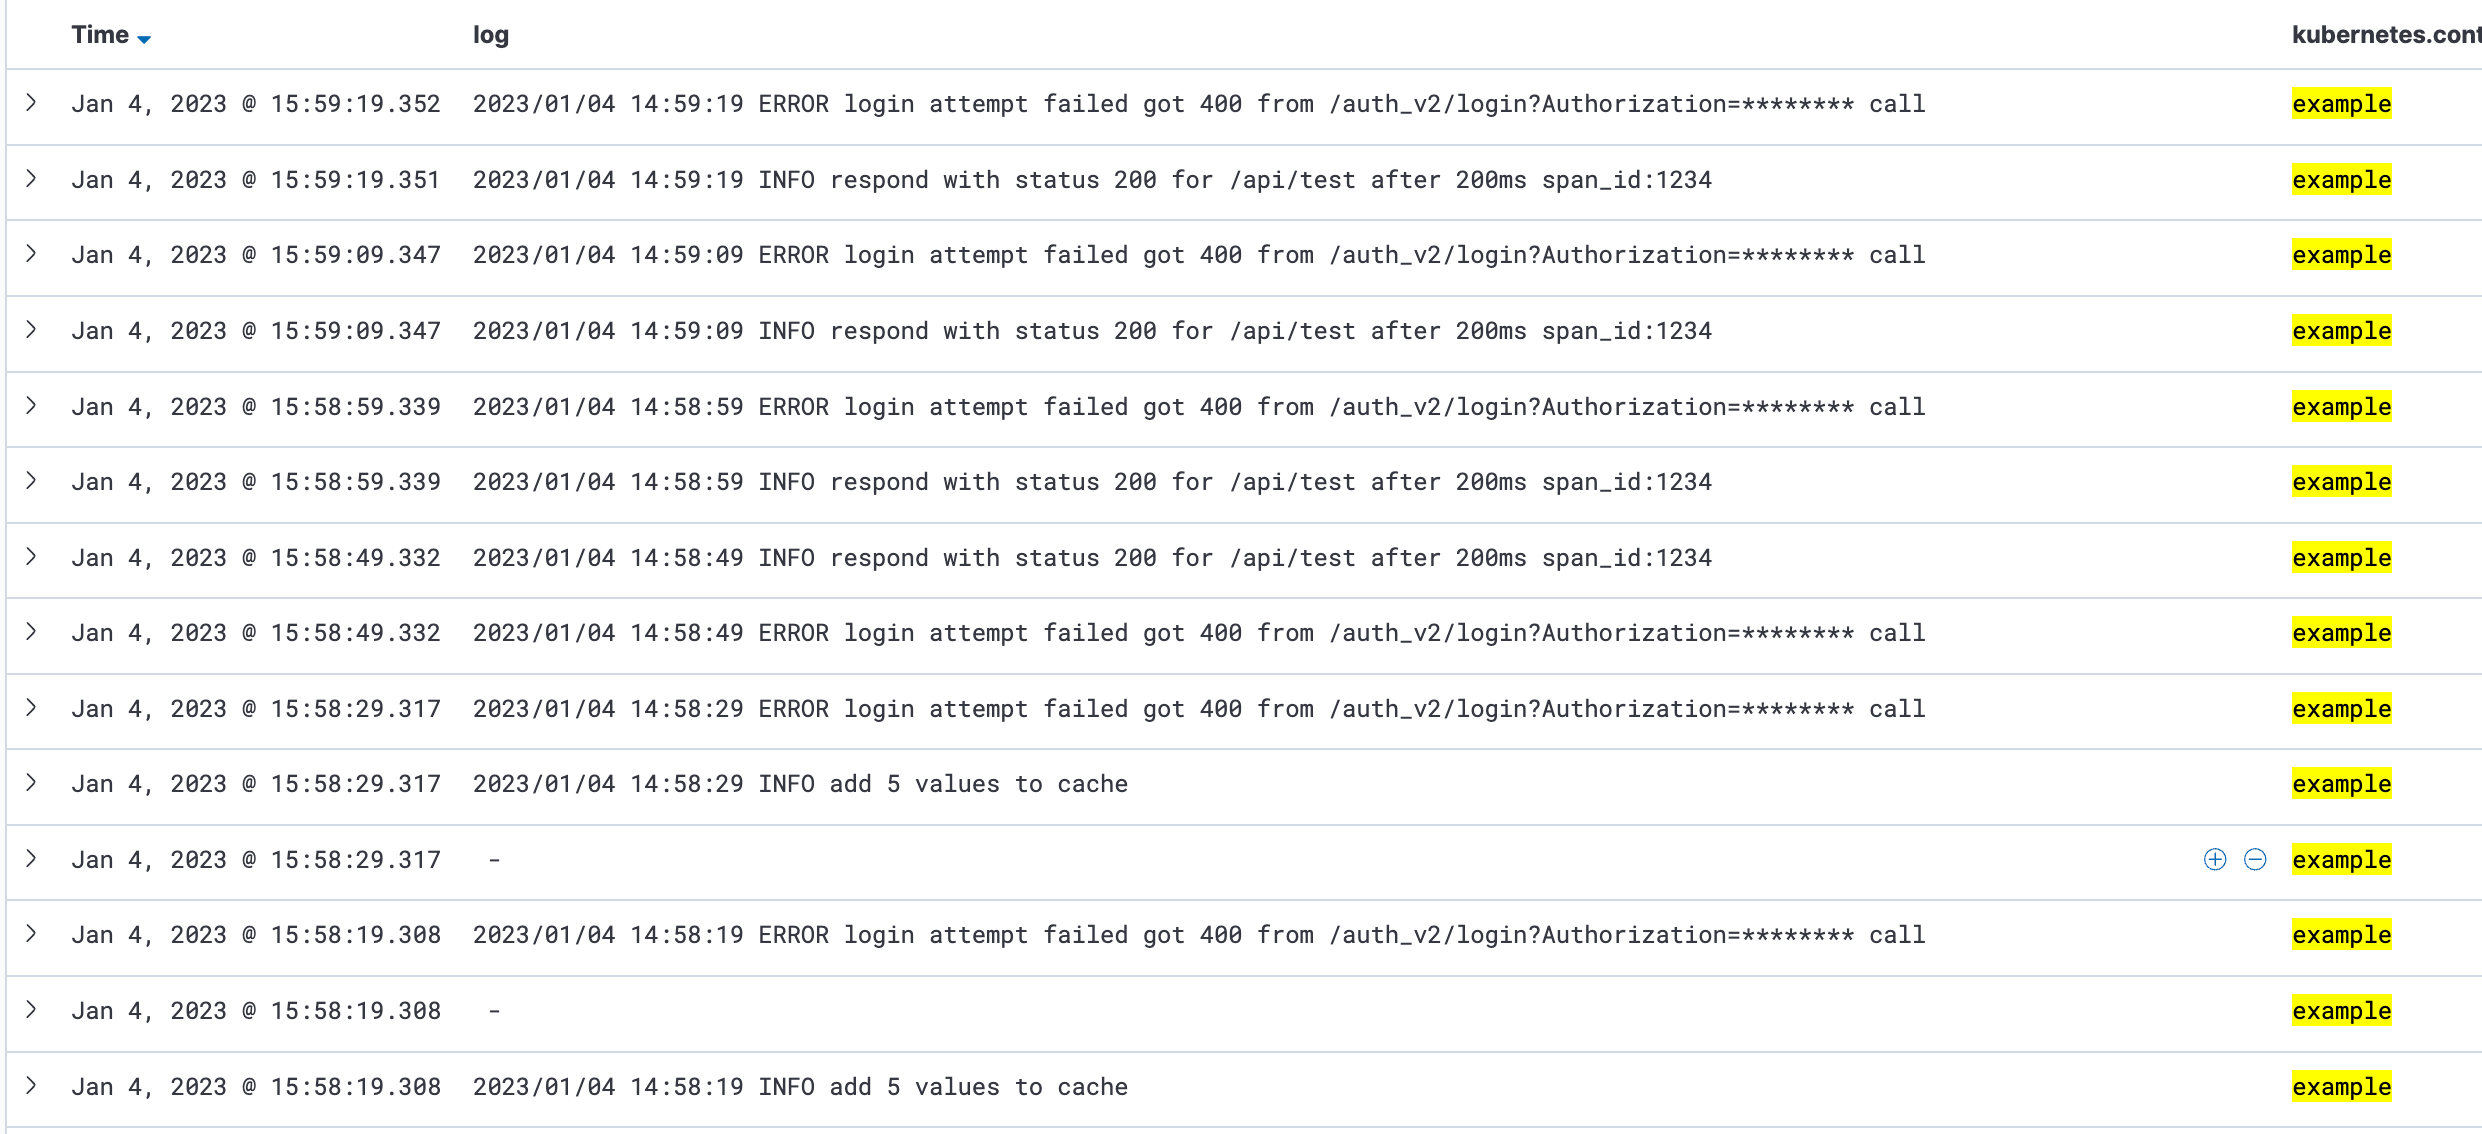
As you can see in the picture, the basic auth string has been replaced by asterisks. Now we would be able, for example, to work with the log without it containing sensitive data. A possible use case would mean that a log does not necessarily contain a password, but a certain piece of information. This may be read in the private Kubernetes cluster, but not in the outsourced database at the cloud provider.
You can find more information about the Lua filter here: https://docs.fluentbit.io/manual/pipeline/filters/lua
Log 3—Timestamp: INFO add 5 values to cache
We do not need this log in our database and want to remove it.
For this, we just need a grep filter that runs a regex over the logs and discards or keeps them based on the setting. For the log in question, it looks like this:
[FILTER]
  Name grep
  Match *
  Exclude log ^.*add d+ values.*$
A popular use case of Grep is to remove logs from certain applications. For example, if we don’t want logs from a particular namespace, we can ignore the logs with Grep. You can find more information on the Grep filter here: https://docs.fluentbit.io/manual/pipeline/filters/grep
Conclusion
With good logs, we ensure the quality of our system landscape. However, we cannot always rule out that all logs generated by our applications provide added value and that they are also easy to analyze. With the right tools though, for example Fluent Bit and OpenSearch, we are able to collect necessary logs in a central location, and structure and visualize them for our use cases.


