Prometheus Monitoring—Fix It before It Breaks
I’ve just made myself a coffee and I’m in a good mood, when all of a sudden my smartphone rings. At the other end of the line, a customer frantically tells me that his users can no longer log on to his website. From one minute to the next, the peace and quiet is over – after all, we are losing money every second.
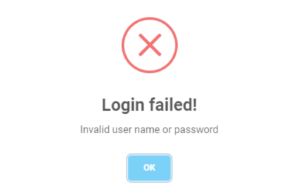
But why? No idea. So we start investigating and see the error message for ourselves. The front end is there and asks us, politely as usual, for our access data. After entering them, we too are suddenly faced with a relatively meager error message.
Unexpected Journey—I’m Going on an Adventure!
Weird. That’s not the way it’s supposed to be, but at least the front end is still responding. As the error source is not obvious at first glance, we will have to check one service after another.
So, we take a look at the back end. This service also looks ready for use from the outside, but a test API call shows us relatively quickly that the call to the authentication service, which should validate our token, is only answered with the not very informative HTTP status code 500.
Since we have ruled out the back end as the culprit, we continue down the troubleshooting path, knowing full well that the downtime has real consequences and that every minute counts—a truly helpful thought when you’re trying to focus on identifying the source of error.
The authentication service logs tell us that during incoming calls, it is trying to reach a database where our rights management is persisted, but without success. Looks like we’re getting closer to the root of the problem. As we know our environment exactly, we arecaware that the database in question is a mirror of a core database and is regularly synchronized with it via a CronJob. However, the logs of the database now indicate that this synchronization was not executed as planned. This means that access to the data is denied because it may not be up to date, and thus our rights management is corrupted.
So the real villain seems to be our synchronization job, but why? A single look at the right place is enough for us to see that the node on which the job was supposed to run has a massive resource problem. It no longer has enough memory to start the container for synchronization.
After a one-liner changing the configuration and starting the container on a different node, the original error is fixed and, as if by magic, our users can log into the front end without any problems.
That was Stressful—and Really Cost-Intensive
In fact, the solution was quite easy, wasn’t it? Maybe, but the analysis still cost us two hours and probably a lot of money for the customer. In the worst case, the user’s trust is irretrievably lost, as some may now no longer use the service.
Wouldn’t it have been nice if we could have identified this resource problem? And wouldn’t it have been even nicer if we could have prevented the problem from occurrring in the first place?
Monitoring—the Solution
Monitoring can become a challenge, especially in distributed and highly dynamic container environments, such as Kubernetes or OpenShift. Fortunately, Prometheus has already developed a solution for this.
Chronologically speaking, Prometheus Monitoring is the second project after Kubernetes hosted by the Cloud Native Computing Foundation. It offers a monitoring and alerting toolkit that is ideal for the container environments mentioned.
The main features of a modern monitoring system include a multidimensional data model consisting of time series data in the form of key/value pairs, which are assigned to the metric by name. Prometheus also has a strong query language, PromQL, which allows you to use the collected data in various constellations. Data is retrieved via a pull mechanism through HTTP, and the targets for this retrieval can either be exposed dynamically via service discovery or configured statically. For short-lived jobs that would only occur between pull intervals, there’s a push gateway to which these jobs can send their metrics before disappearing again.
The official Helm Chart kube-prometheus-stack is particularly recommended in the Kubernetes context. With a single command, you also get Grafana with preconfigured dashboards that provide direct insight into the resources of the nodes.
Not Only Fit for Kubernetes
If you think that Prometheus Monitoring is mainly suited for Kubernetes, you are not completely wrong. Nevertheless, Prometheus also offers excellent monitoring on individual VMs or bare-metal servers if it is started as a Docker container. Now, if you want to get the metrics from a specific machine, all that is needed is the Node Exporter, which is cloned as a GitHub project and just needs to be run. That’s all you need to get extremely deep metrics. Once this is in progress, the Prometheus container can access the metrics provided by the Node Exporter at localhost:9090/metrics. by default.
No Control without Visibility
With Prometheus, distributed monitoring is no longer an impossible task and should be one of the three standard stacks rolled out in any environment, especially in a DevOps context, along with tracing and logging. In the anecdote described at the beginning, a quick look at the status of the nodes would have been sufficient to detect the resource problem. This would have saved us the time-consuming backtracking. In the best case scenario, we would have set up an alerting system beforehand based on our metrics, which would have alerted us to the impending resource shortage on a node. Then we would have eliminated this risk in just a few minutes. Then we would have eliminated this risk in a matter of minutes.
In a DevOps context, good monitoring saves you a lot of stress, and you can enjoy your coffee in peace. The premise under which we conduct monitoring for our customers is always “fix it before it breaks.”


