Trace All the Things
When people plan infrastructures and architectures, they usually pay a lot of attention to logging and monitoring right from the start. The idea of tracing is often neglected until the first inexplicable problem occurs. It is my mission to prevent this.
Why Is Tracing Important And What Do I Need It For?
Tracing is a method in IT and DevOps teams to monitor applications. And, more importantly, to measure them. Tracing becomes especially interesting for applications that consist of microservices.
Troubleshooting and measuring the performance of our applications at request level becomes increasingly difficult the more services are involved. It is even more important that we really understand how our systems behave and why they do whatever they do.
That’s why we start thinking about things like logging and monitoring when we first start planning microservice architectures. Monitoring systems, such as Prometheus, help us better understand system behavior, while logging systems such as Greylog or Elasticstack help us find and analyze errors. Ideally, this data is stored in a central location (such as Elasticsearch) and made easily accessible via user interfaces (such as Kibana).
Request Tracing Should Be the Logical Consequence of Logging and Monitoring
Tracing helps us find out exactly where errors occur and which component of our architecture, even which specific part of the component, is performing suboptimally.
Despite all this, we usually do not give tracing the attention it deserves in the initial planning of systems. Instead, tracing is implemented when the first “unexplainable” error report is generated. For example, your customer calls and asks why their request from yesterday took so long. Without a reliable tracing system, it will be difficult to give valid answers to such questions.
This is why appropriate logging, monitoring, and tracing stacks are so important. Together, these three stacks form the basis for analyzing, operating, and ultimately optimizing our systems—only then can we really understand everything that happens.
If Tracing Is So Important, Why Doesn’t Everyone Always Use It?
The answer is actually quite simple. Tracing in distributed infrastructures and architectures involves one or more challenges. Setting up a tracing system is not exactly simple.
Our tracing system has to adequately represent the tracing context both within and between our processes. That’s not easy. To accomplish this, pretty much every part of our application needs to be touched.
Fun fact: microservices mean that there are SEVERAL places where we need to take action.
Also, you may not be working alone with the system and there might be many different people responsible for different parts of the application. Maybe those people don’t even work in the same company. Maybe there are standard components built into the application that you haven’t lovingly crafted yourself, such as Traefik or nginx as a software load balancer. And this is where the fun starts. And this is where the fun starts.
So, what we need is a standard that can be used by everyone without significantly complicating everyday work. This is where the OpenTelemetry standard comes into play. This standard allows everyone to implement tracing in their own code without being tied to a specific vendor.
How Does Tracing Work?
The tracing component of the OpenTelemetry standard consists of two concepts.
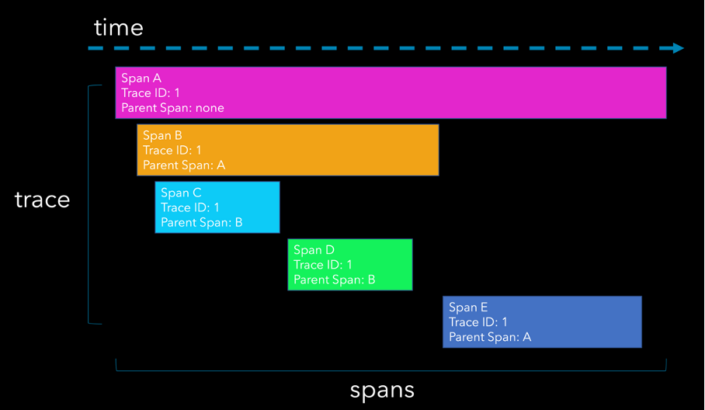
First of all, we have “spans.” They measure the time it takes to execute a single part of our workload. So, in the example above, we see the long pink span. This could be the time our software load balancer took from receiving a request to sending the response.
This information alone is not worth much. The first step is to generate what is called a “trace ID” by creating this first span.
Our first real service that was involved in this request is represented by the orange area. It is important that the trace ID is passed to this service.
Now this service creates its own span. The trace ID is not changed, so that it is possible to link the two events together and understand what happened at a later point in time.
The workload of our service is divided into two steps, each represented by its own span. When our service is done, it calls another service (dark blue) and passes on the trace ID here as well.
The sum of all these spans involved in this one request is called the “trace”.
Implementation
Each of the components in our system landscape is treated in a completely isolated way. It doesn’t matter what kind of application we run as long as we implement the OpenTelemetry standard. There are libraries for almost any type of application we want to operate, such as Springboot, JEE, Go, etc.
The ultimate tracing technology we will use in our system can be switched by a simple configuration change. Examples are Zipkin or Jaeger. There is no need to change anything in our applications once OpenTelemetry is set up.
Enter Jaeger
Jaeger is of course compatible with the OpenTelemetry data model and its libraries, which we have already introduced.
Jaeger itself is written in Go and provides the ideal basis for a setup in Kubernetes. It is lightweight and extremely fast. We can set up a data store of our choice, for example Elasticsearch, Cassandra, or even Kafka. Let’s take a quick look at how Jaeger integrates with our systems.
Jaeger consists of several different parts that we want to include in our system. To try it out, we can use the “all-in-one” Docker image to get a feel for Jaeger.
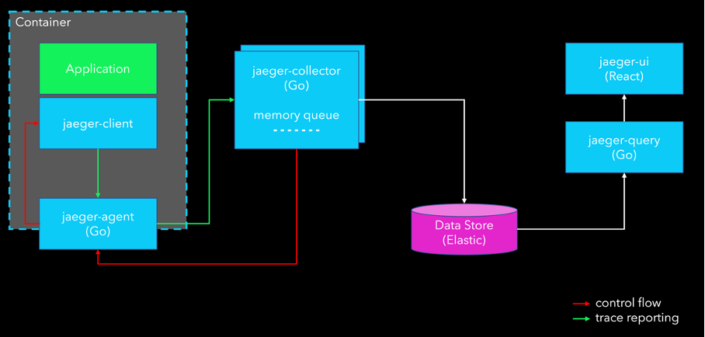
When deploying Jaeger to the “real world”, we first implement the OpenTelemetry client libraries in our application code.
At the infrastructure level, we see the “jaeger-agent”, the component that transports our traces to the system. These jaeger-agents can be deployed in any container as a “sidecar” or as a DaemonSet in the cluster. Agents can have multiple instances, but do not have to. To ensure the shortest possible network distances, it is recommended to launch multiple agents.
These agents report to a jaeger-collector, which sends the traces to the data store of our choice.
The jaeger-query is used to search for our traces. The graphical interface is called jaeger-ui. Basically, the jaeger-ui is the Kibana of tracing.
Conclusion
We have seen that there is an easy way to integrate request tracing in microservice architectures with the OpenTelemetry standard and Jaeger as downstream technology. With the one-image solution, you can try it all out and get started yourself.
Since tracing is missing in most systems, I hope to have created a little awareness with this. What we should bear in mind at all times: without tracing, we will always have blind spots in our systems. That does not correspond to our value proposition.
Sascha hat mehrere Jahre Erfahrung in der Leitung von Cloud-Projekten und der Entwicklung hochverfügbarer Cloud-Architekturen. Er ist Spezialist für DevSecOps und Container-Orchestrierung und unterstützt Unternehmen vor allem beim Aufbau von Clusterlösungen, CI/CD-Ketten und Analyse-Stacks.


